'Until about 20 years ago, climate researchers avoided linking extreme weather events such as heatwaves, droughts or heavy rainfall to climate change in detail. After all, there is an important, fundamental difference between weather and climate: weather is what happens in a short period of minutes to weeks, including a good portion of chaotic randomness. Climate, on the other hand, extends over many years and, strictly speaking, corresponds not only to the "average weather", as is so often simplified, but to the entire statistical distribution of weather conditions and their evolution. It was not until 2003 that Myles Allen drew attention to the fact that the statistical relationship between weather and climate makes it possible to quantify the influence of climate change on specific extreme weather events (1).
Since then, attribution research has been investigating how the probability and intensity of specific extreme events has changed as a result of climate change. To this end, simulations of climate models are evaluated as thoroughly as possible, both in today's climate and in the pre-industrial climate. First, an event type is defined that is relevant for an observed event - in the case of a summer heatwave, for example, the highest annual 3-day mean temperature. Basically, it is then counted how often the value of the observed event is reached or exceeded in the climate simulations in the affected region, and how this frequency changes with the climate state. This probabilistic method was perfected by the "World Weather Attribution" group and has been regularly applied to current extreme events for several years (2). This method is now also being used by the German Weather Service (3).
However, the probabilistic method of attribution research reaches its limits when it comes to particularly extreme events that do not or hardly ever occur in previous simulations. In such cases, no robust statements can be made about changes in probability. The question also arises why the probability of an event changes: Is it simply due to the increased temperatures caused by greenhouse gases and how these directly affect other parameters thermodynamically, or do more complex changes in the wind systems play a role? For example, are blocking weather patterns becoming more frequent and/or more persistent, or is the opposite perhaps the case? In fact, such changes in atmospheric dynamics are subject to great uncertainty and usually differ from model to model (4). Event-based storylines (5) circumvent these problems by asking: How would an observed extreme event have played out if the same wind patterns had occurred in a different climate state?

Figure 1: Maximum daily temperature on July 25, 2019 in Germany in today's climate (center), as well as in the pre-industrial (left) and globally 4 °C warmer climate according to AWI-CM1 storyline simulations corrected with observational data. Figure from Sánchez-Benítez et al. 2022 (7)
![]() We are pursuing this approach as part of the Helmholtz Innovation Pool project SCENIC (short for: Storyline Scenarios of Extreme Weather, Climate, and Environmental Events along with their Impacts in a Warmer World, 2022-2024), which builds on preliminary work within the Helmholtz Climate Initiative (6). First, the large-scale winds in global climate model simulations are prescribed by means of "nudging" using ERA5 reanalysis data. Several such simulations, each with a different background climate, have been carried out at DKRZ.
We are pursuing this approach as part of the Helmholtz Innovation Pool project SCENIC (short for: Storyline Scenarios of Extreme Weather, Climate, and Environmental Events along with their Impacts in a Warmer World, 2022-2024), which builds on preliminary work within the Helmholtz Climate Initiative (6). First, the large-scale winds in global climate model simulations are prescribed by means of "nudging" using ERA5 reanalysis data. Several such simulations, each with a different background climate, have been carried out at DKRZ.

Figure 2: Sea surface temperature anomalies in the North Pacific in summer (JJA) 2019 compared to the reference period 1984-2014, in the ERA5 reanalysis (top) and in different climate states according to AWI-CM-1 storyline simulations (bottom). Figure from Athanase et al. 2024 (8).
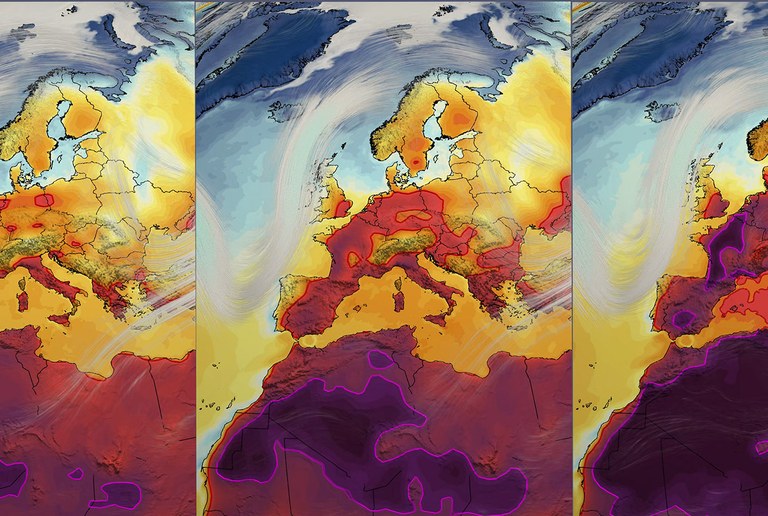
Video 1: The heatwave in July 2019 in a 4 °C warmer world. The visualization shows the same simulated weather sequence in the three images: on the left for the pre-industrial climate, in the middle for today's climate and on the right for a 4 °C warmer world. The wind at an altitude of around 10 km is shown as white stripes, the daily maximum surface temperature is shown by means of the colors and the sea ice concentration as white shading in and around Europe. The video is also available directly on YouTube: https://www.youtube.com/watch?v=Rzr5kWRytZY
The global storyline simulations have already made interesting analyses possible. For example, we were able to show that according to the AWI climate model (AWI-CM-1), the heatwave in Germany in July 2019 was already 3°C more intense due to climate change; instead of 40 °C in some regions, a more moderate 37 °C would have been reached without climate change (Fig. 1). In a globally 4 °C warmer climate, temperatures would even have reached 47 °C. The increased warming of 10 °C compared to a global average of 4 °C is based on the well-known land-sea contrast of warming. However, the difference is particularly pronounced in this case, as evaporative cooling comes to a stop due to drying soils (7).

Figure 3: Left: Daily maximum of the near-surface air temperature on July 25, 2019 according to ICON-12 km (Europe) and ICON-3 km (Germany), Right: Course of the daily mean and daily maximum temperature in Germany in July 2019 according to the three model configurations and observations (HYRAS). Figure from Klimiuk et al. in preparation (9).
Another central aspect of SCENIC is the generation of refined data through dynamic downscaling with regional models based on the global storylines (resolution of approx. 100 km). For this purpose, we primarily use regional ICON configurations for Europe (with a resolution of approx. 12 km) and for Germany (with approx. 3 km; Fig. 3 left), but also even finer WRF configurations (approx. 1 km) for smaller areas as well as AI methods from the field of neural networks (9). The aim is to obtain more precise data that better reflects the important influence of orography, land use, soil properties, coastal geometry, etc. on a regional scale, as well as smaller-scale events, for example in connection with heavy rainfall. Heavy rainfall events such as the one that led to destruction in the Ahr valley in 2021 have proven to be difficult to reproduce. Nevertheless, important improvements have been achieved through the use of regional models. For example, the regional storylines more realistically reproduce the daily maximum temperatures during heatwaves, which are underestimated in the global model (Fig. 3 right). The ICON-based storylines also show a warming of over 8 °C at the peak of the July 2019 heatwave between pre-industrial and globally 4 °C warmer climate (Fig. 3 left) (10).
The global and especially the regional storyline data are used by other Helmholtz project partners to drive various land surface models and thus generate even more detailed impact storylines. The focus here is on both agricultural and hydrological aspects. For 2024, SCENIC has set itself the goal of using the diverse data to comprehensively illuminate the influence of past and future climate change on the European heat and drought summers since 2018 from a storyline perspective.
References:
(1) Allen, M. (2003). Liability for climate change. Nature 421, 891–892 (2003). https://doi.org/10.1038/421891a
(2) https://www.worldweatherattribution.org
(3) https://www.dwd.de/DE/leistungen/attributionsforschung/attributionen.html
(4) Shepherd, T. G. (2014). Atmospheric circulation as a source of uncertainty in climate change projections. Nature Geoscience, 7(10), 703-708. https://doi.org/10.1038/ngeo2253
(5) Shepherd, T. G., Boyd, E., Calel, R. A., Chapman, S. C., Dessai, S., Dima-West, I. M., ... & Zenghelis, D. A. (2018). Storylines: an alternative approach to representing uncertainty in physical aspects of climate change. Climatic change, 151, 555-571. https://doi.org/10.1007/s10584-018-2317-9
(6) https://www.helmholtz-klima.de
(7) Sánchez-Benítez, A., Goessling, H., Pithan, F., Semmler, T., & Jung, T. (2022). The July 2019 European heat wave in a warmer climate: storyline scenarios with a coupled model using spectral nudging. Journal of Climate, 35(8), 2373-2390. https://doi.org/10.1175/JCLI-D-21-0573.1
(8) Athanase, M., Sánchez-Benítez, A., Goessling, H. F., Pithan, F., & Jung, T. (2024). Projected amplification of summer marine heatwaves in a warming Northeast Pacific Ocean. Communications Earth & Environment, 5(1), 53. https://doi.org/10.1038/s43247-024-01212-1
(9) Glawion, L., Polz, J., Kunstmann, H., Fersch, B., & Chwala, C. (2023). spateGAN: Spatio-temporal downscaling of rainfall fields using a cGAN approach. Earth and Space Science, 10, e2023EA002906. doi: 10.1029/2023EA002906
(10) Klimiuk, T., Ludwig. P., Sánchez-Benítez, A., Goessling, H., Braesicke, P., Pinto, J.G. (in prep). A Regional Perspective of Storyline Simulations of the Recent European Summer Heatwaves.
Authors and scientific contact:
- Alfred-Wegener-Institut, Helmholtz-Zentrum für Polar- und Meeresforschung (AWI): Helge Goessling, Marylou Athanase, Thomas Jung, Antonio Sánchez-Benítez
- Karlsruher Institut für Technologie (KIT), Institut für Meteorologie und Klimaforschung Atmosphärische Umweltforschung (IMK-IFU): Benjamin Fersch, Luca Glawion,
- Karlsruher Institut für Technologie (KIT), Institut für Meteorologie und Klimaforschung Troposphärenforschung (IMKTRO): Tatiana Klimiuk, Patrick Ludwig, Joaquim G. Pinto,